Function reference /Web & finance data
GOOGLEFINANCE
Run in a real sheetPulls stock prices and other market data from Google Finance into the sheet — the current price, or a table of past prices.
GOOGLEFINANCE(ticker, [attribute], [start_date], [end_date|num_days], [interval])
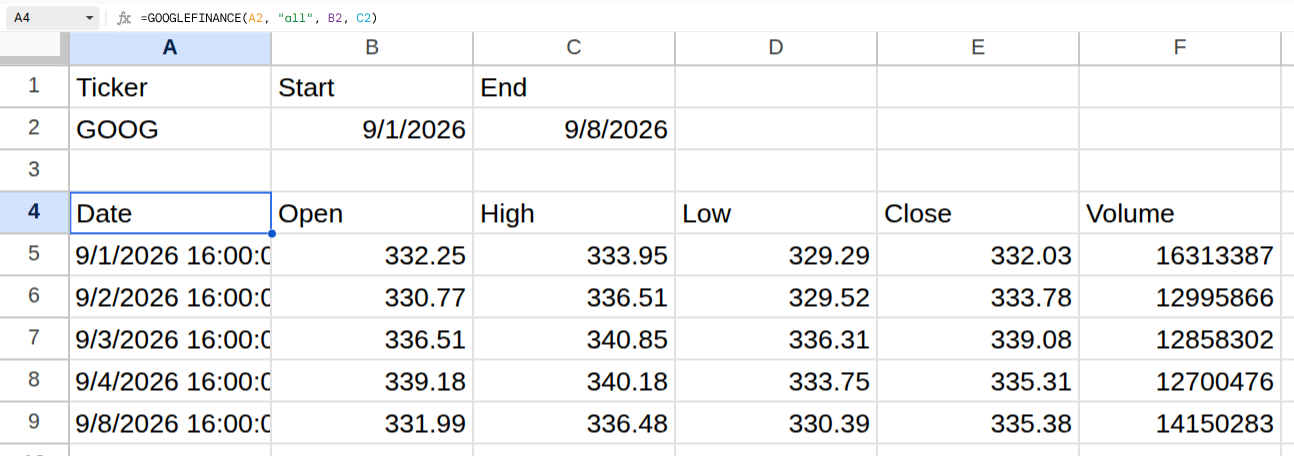
With just a ticker, GOOGLEFINANCE returns the current price in one cell. Give it a start and an end date and it returns a table instead: one row per trading day, with a header row on top.
The attribute "all" is the useful one for history. It returns six columns — Date, Open, High, Low, Close and Volume — which is exactly the shape a stock chart wants: select the first five columns and insert an Open-High-Low-Close chart.
Worked example
| Ticker | Start | End |
|---|---|---|
| GOOG | 9/1/2026 | 9/8/2026 |
=GOOGLEFINANCE(A2, "all", B2, C2)Returns a header row and five trading days of Date, Open, High, Low, Close, Volume.
Arguments
| Argument | Required | What it does |
|---|---|---|
ticker |
Yes | The symbol, in quotes or from a cell: "GOOG", or "NASDAQ:GOOG" to name the exchange. |
attribute |
Optional | What to fetch. "price" is the default. For history, "all" returns Open, High, Low, Close and Volume together; "close" returns just the closing price. |
start_date |
Optional | The first day of the history. Leave it out for current data only. |
end_date|num_days |
Optional | The last day (included), or a number of days after start_date. |
interval |
Optional | "DAILY" (the default) or "WEEKLY". |
Gotchas
- 01Only trading days get a row. Weekends and market holidays are simply missing, so a 30-day window returns about 21 rows.
- 02The dates come back with a time attached (9/1/2026 16:00:00, the market close). Select the column and press Ctrl+Shift+3 to show plain dates — a chart's axis labels follow.
- 03For a window that keeps moving, use TODAY(): =GOOGLEFINANCE("GOOG", "all", TODAY()-30, TODAY()). Fixed dates give a table that never changes.
- 04Charting it: select Date through Close (leave Volume out), Insert > Chart, then Chart type > Stock > Open-High-Low-Close. The four price columns are already in the order that chart reads them.
- 05The chart's vertical axis starts at zero, which squashes the candles into a thin strip. Customize > Vertical axis > Min, set just under the lowest Low, spreads them out.
- 06The High-Low-Close chart type reads the same columns by position, so on this five-column range it puts Open where High should be. Stick to Open-High-Low-Close for this layout.
- 07Historical data cannot be refreshed or pulled through the Sheets API, and quotes can be delayed up to 20 minutes.